SecurFinancial CJA Project + AJO Analysis
Introduction
We have created the SecurFinancial CJA Dashboard, which leverages DSN datasets as its underlying data source. This dashboard is designed to provide comprehensive visibility into customer journeys by seamlessly capturing all actions executed within Adobe Journey Optimizer (AJO) for public project journeys.
By consolidating this data, the dashboard enables in-depth analysis of AJO activities, including actions, content performance, and channel effectiveness. This enhanced visibility enables stakeholders to gain a deeper understanding of customer interactions, refine engagement strategies, and inform more data-driven decision-making across initiatives.
Project Details
Organization: Adobe Demo System Shared
Project link(Dashboard): [READ ONLY] DSN FSI STREAM ANALYSIS v2.0
Connection: DSN FSI Data Stream Source v1.0
Data View: DSN FSI Stream v2.0
Project Panels
Marketing Journey Flows
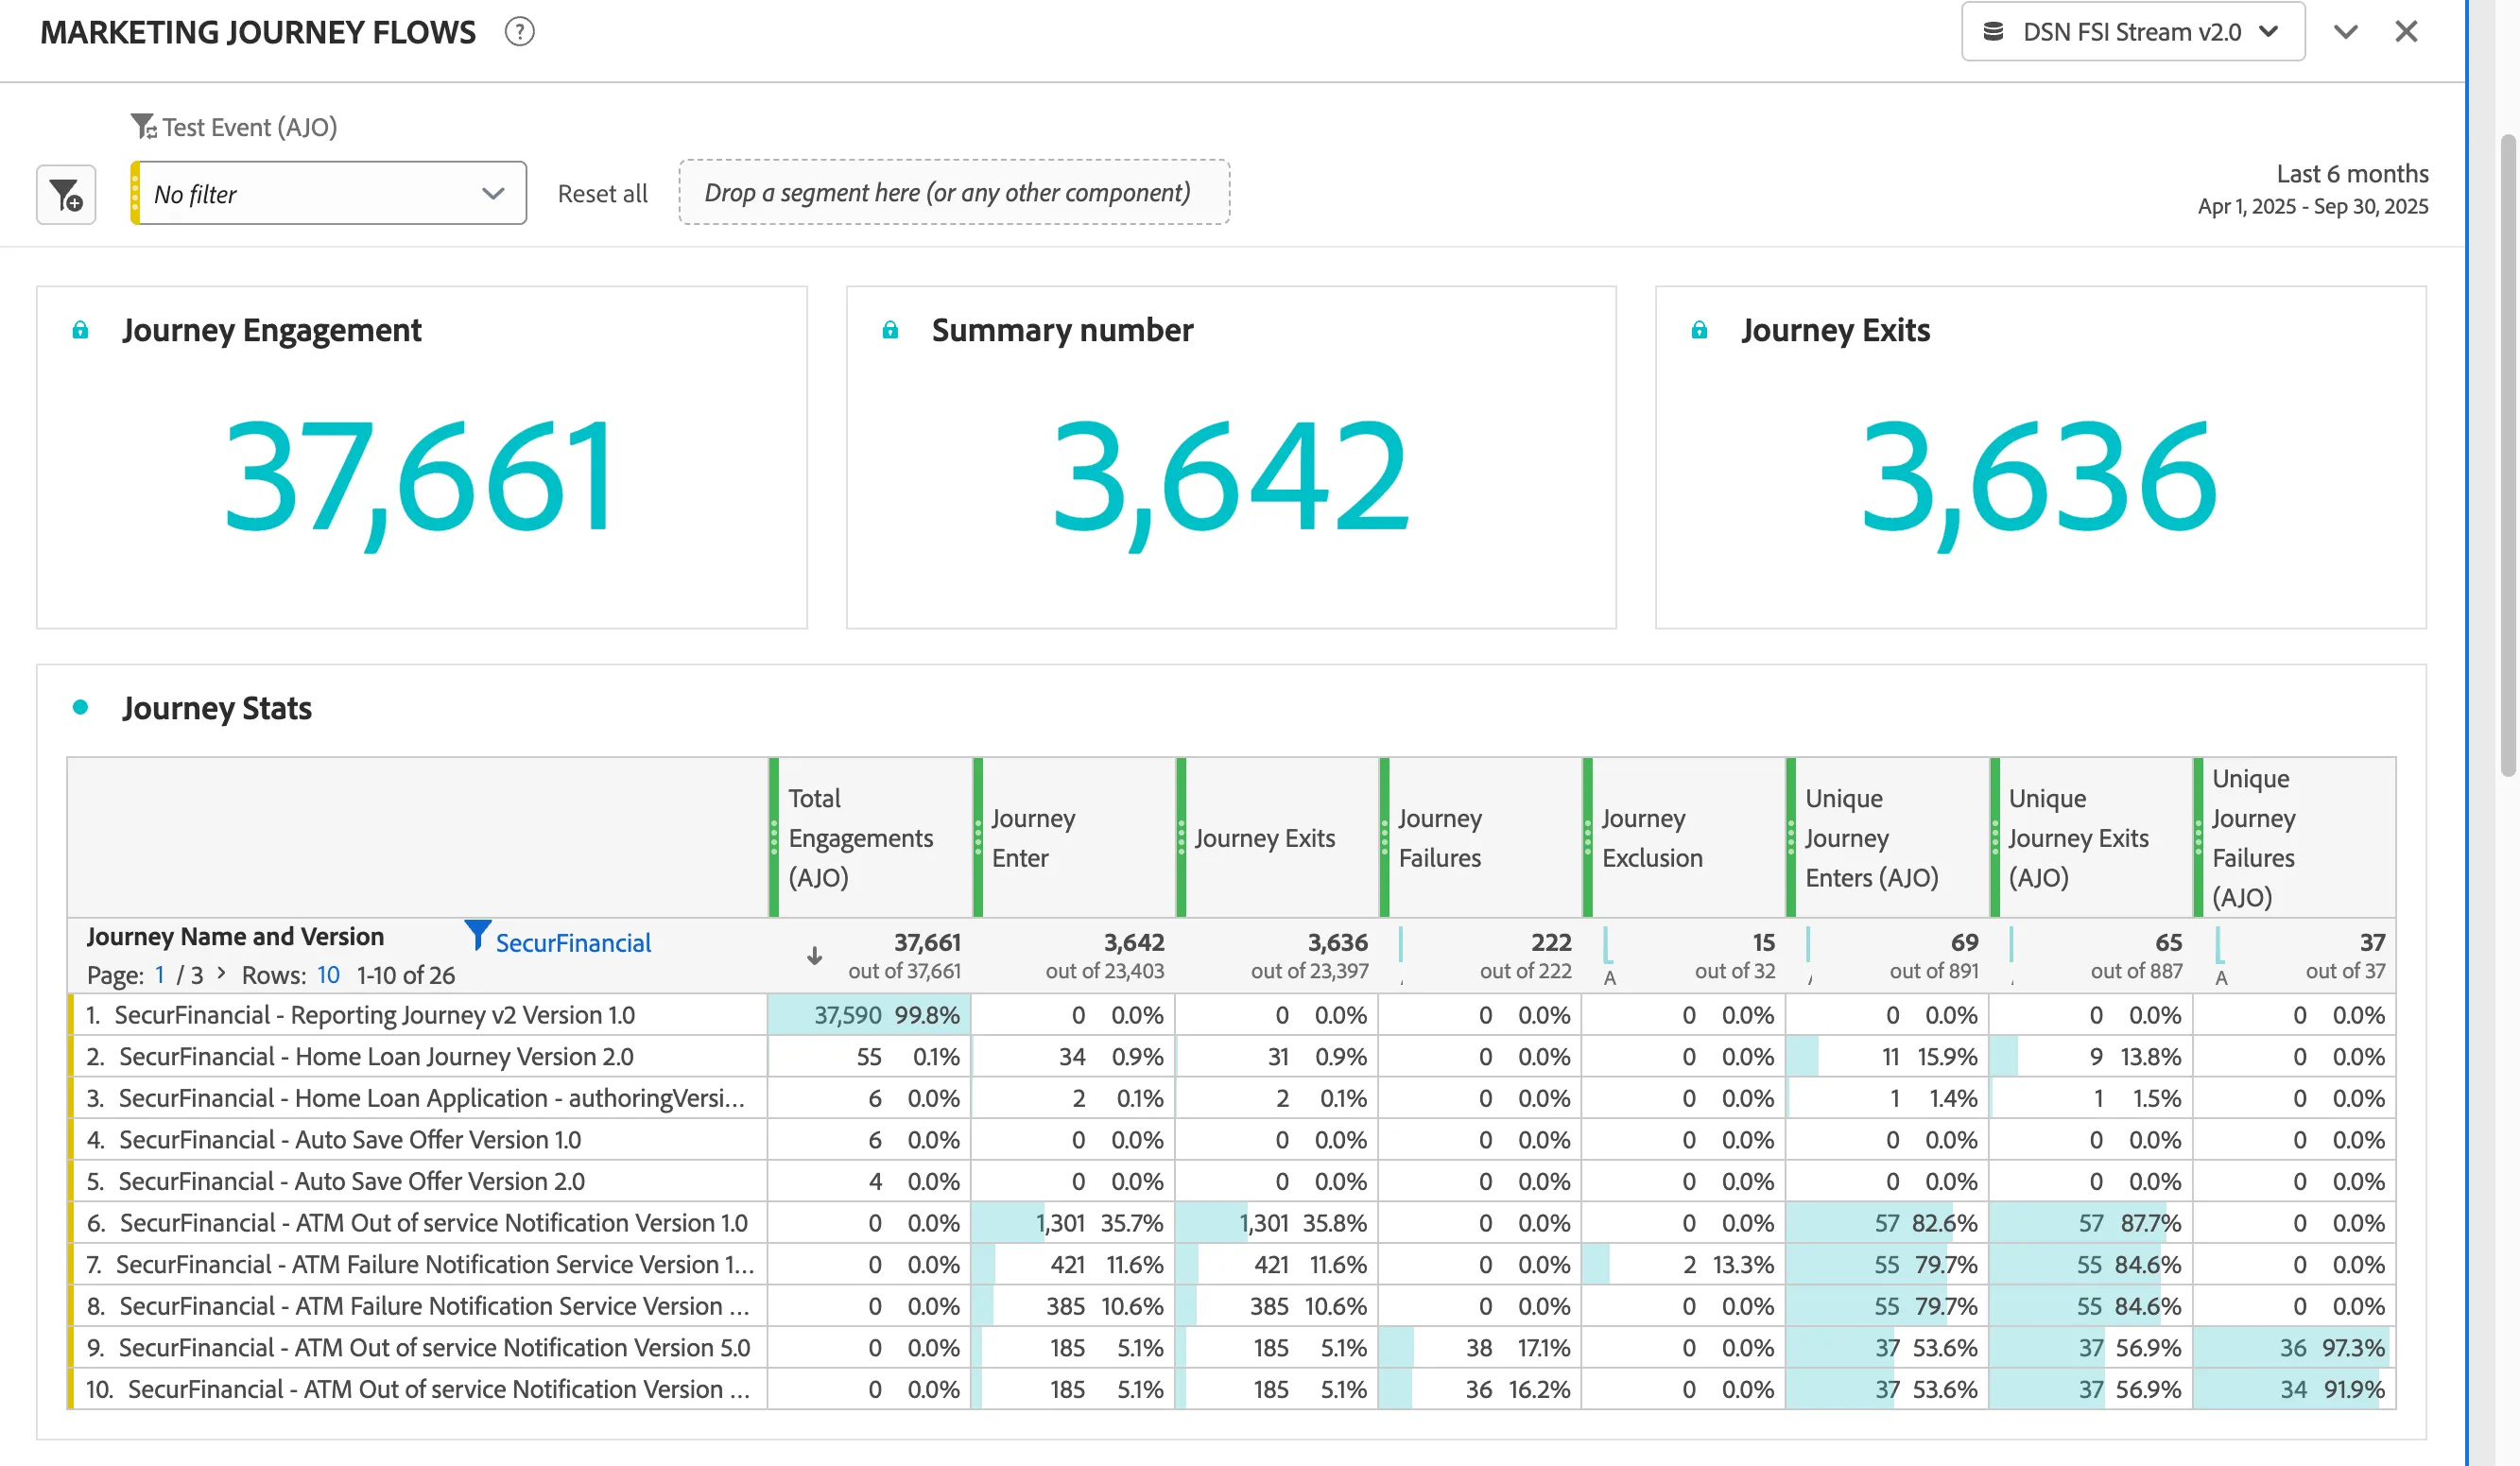
This panel provides a comprehensive overview of the Public Project Journey statistics. It highlights key metrics such as the total number of individuals who entered the journey, the volume and reasons for journey exclusions, as well as any errors encountered during the execution of the journeys.
Action Performance
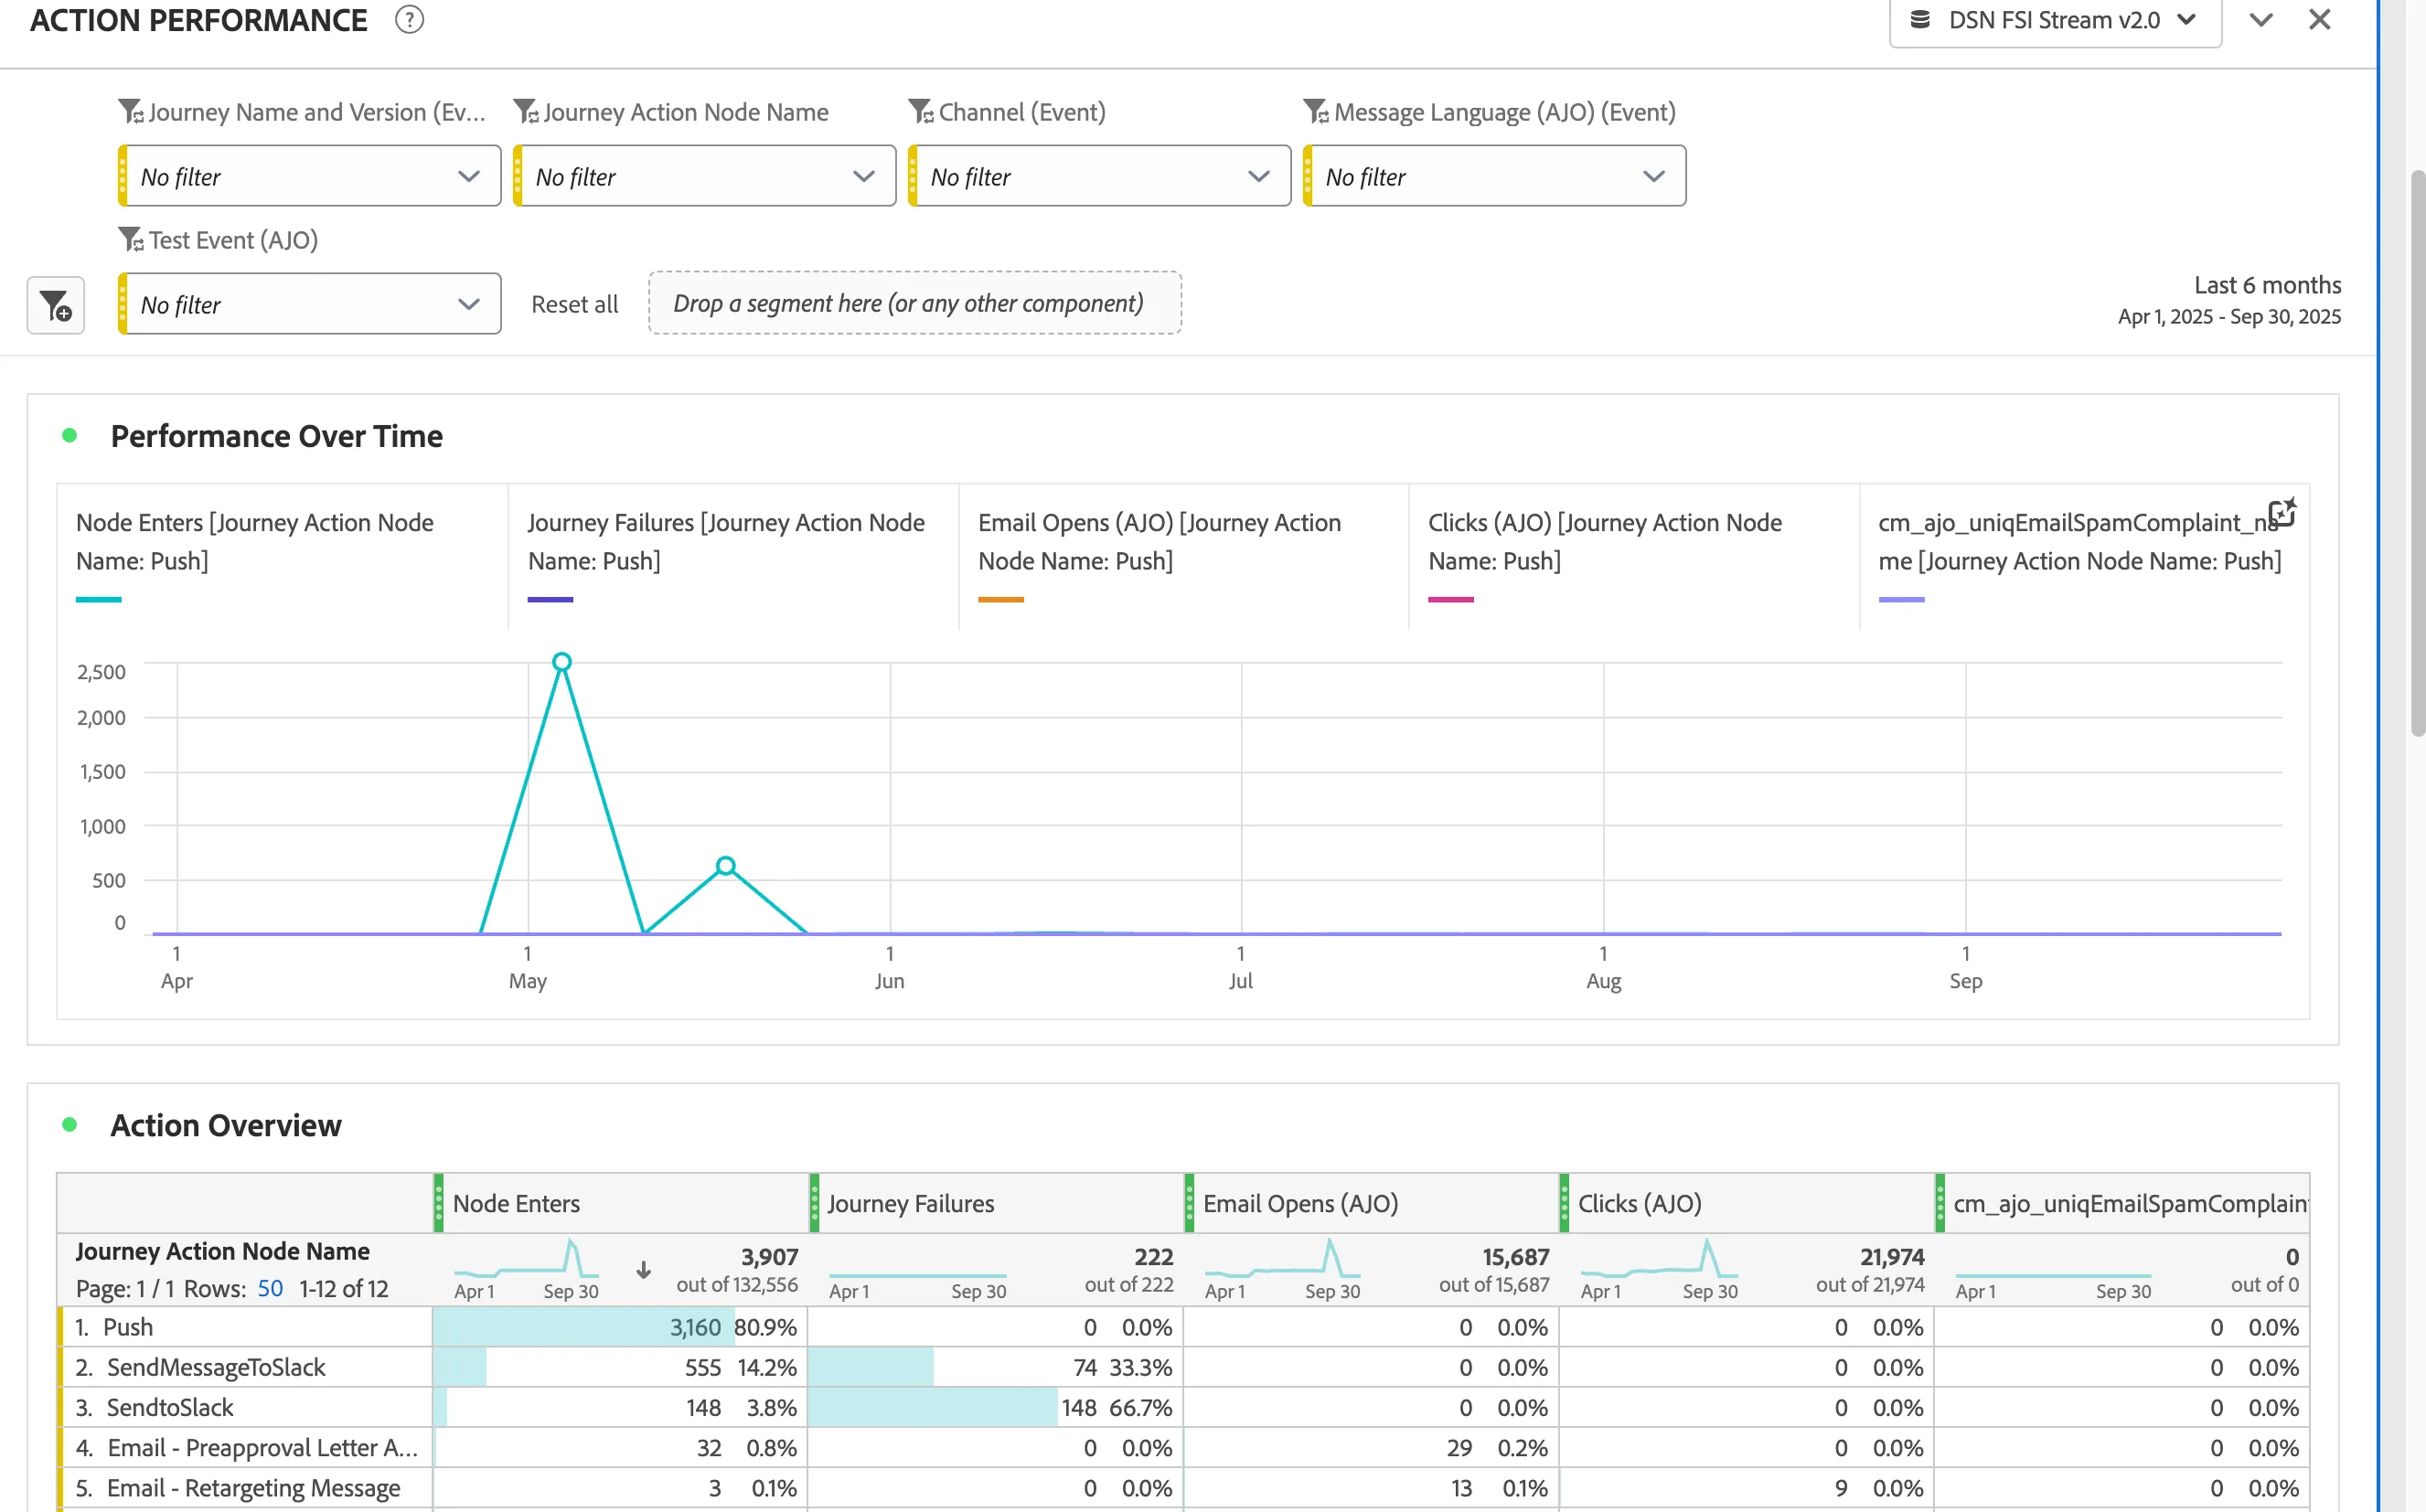
This panel presents a consolidated view of the overall performance of Actions configured within the SecurFinancial Public Project Journeys. It offers detailed insights into how each action has been executed, measured, and responded to, thereby enabling stakeholders to evaluate the effectiveness of journey design and delivery.
Events Performance
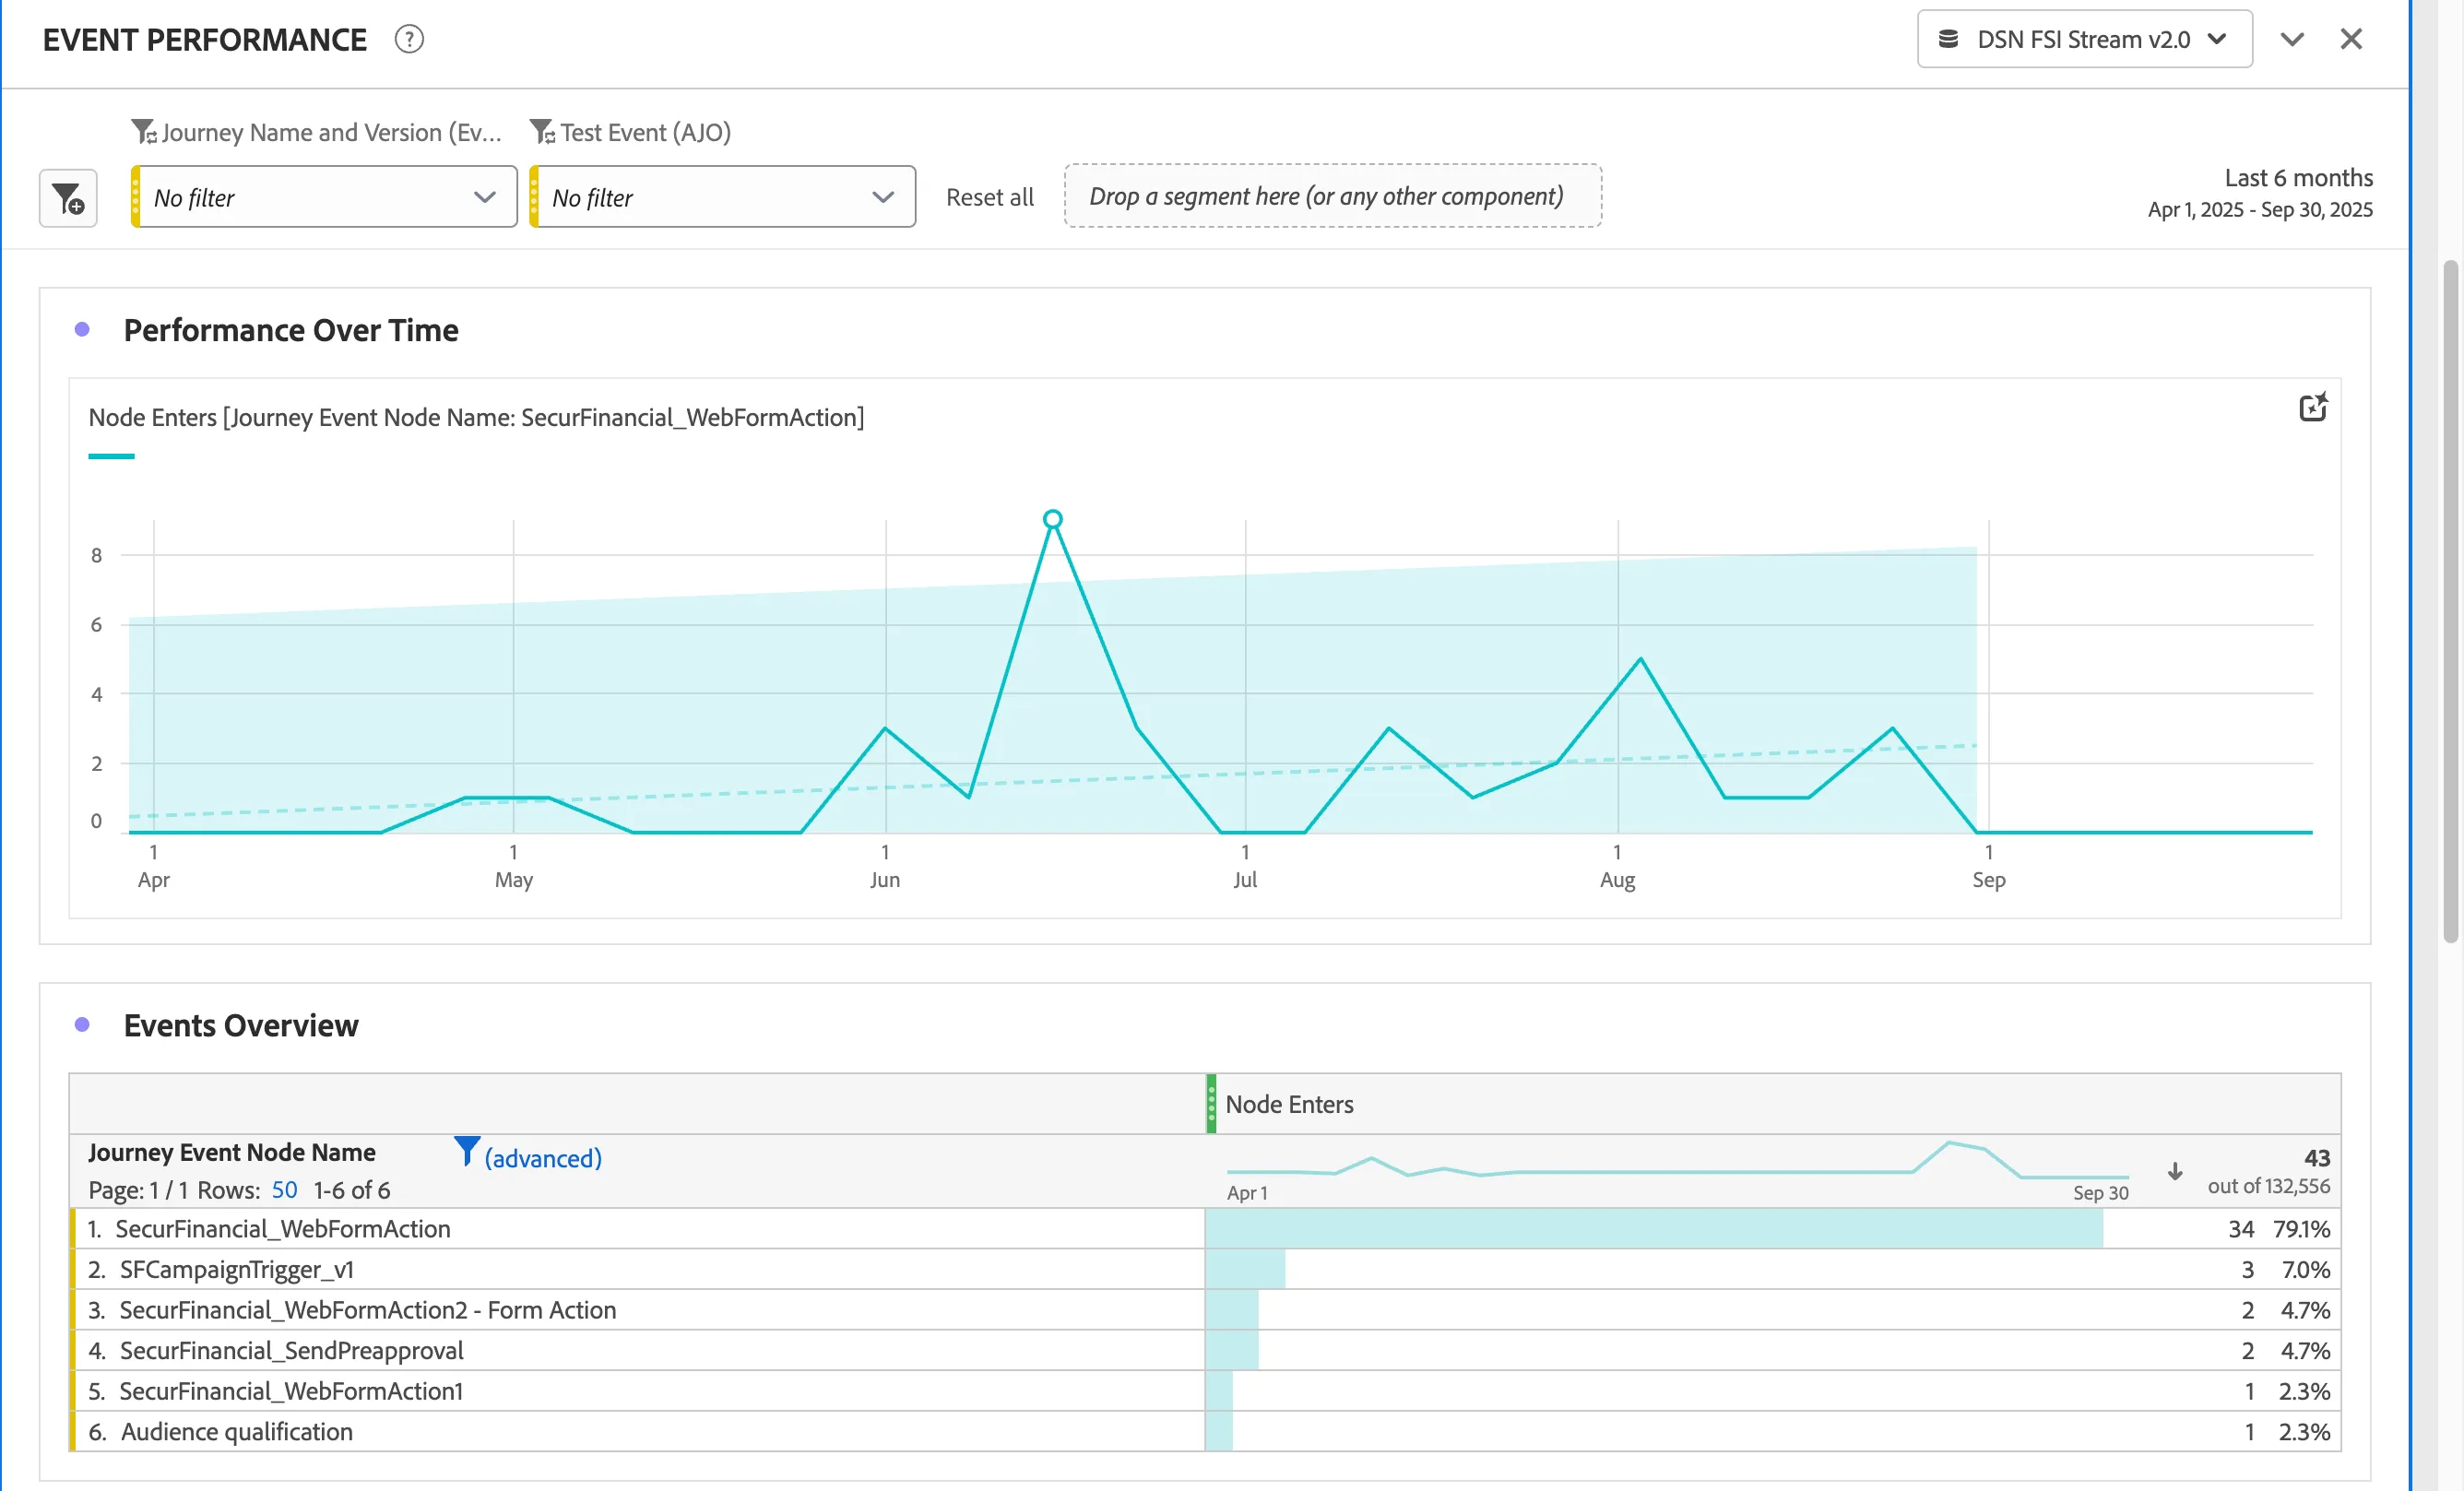
This panel delivers a comprehensive view of the overall performance of events configured within the SecurFinancial Public Project Journeys over a defined period of time. It tracks and analyzes event activity to illustrate how customer interactions unfold throughout the journey, highlighting patterns, trends, and anomalies across the selected timeframe.
Experience Decisioning
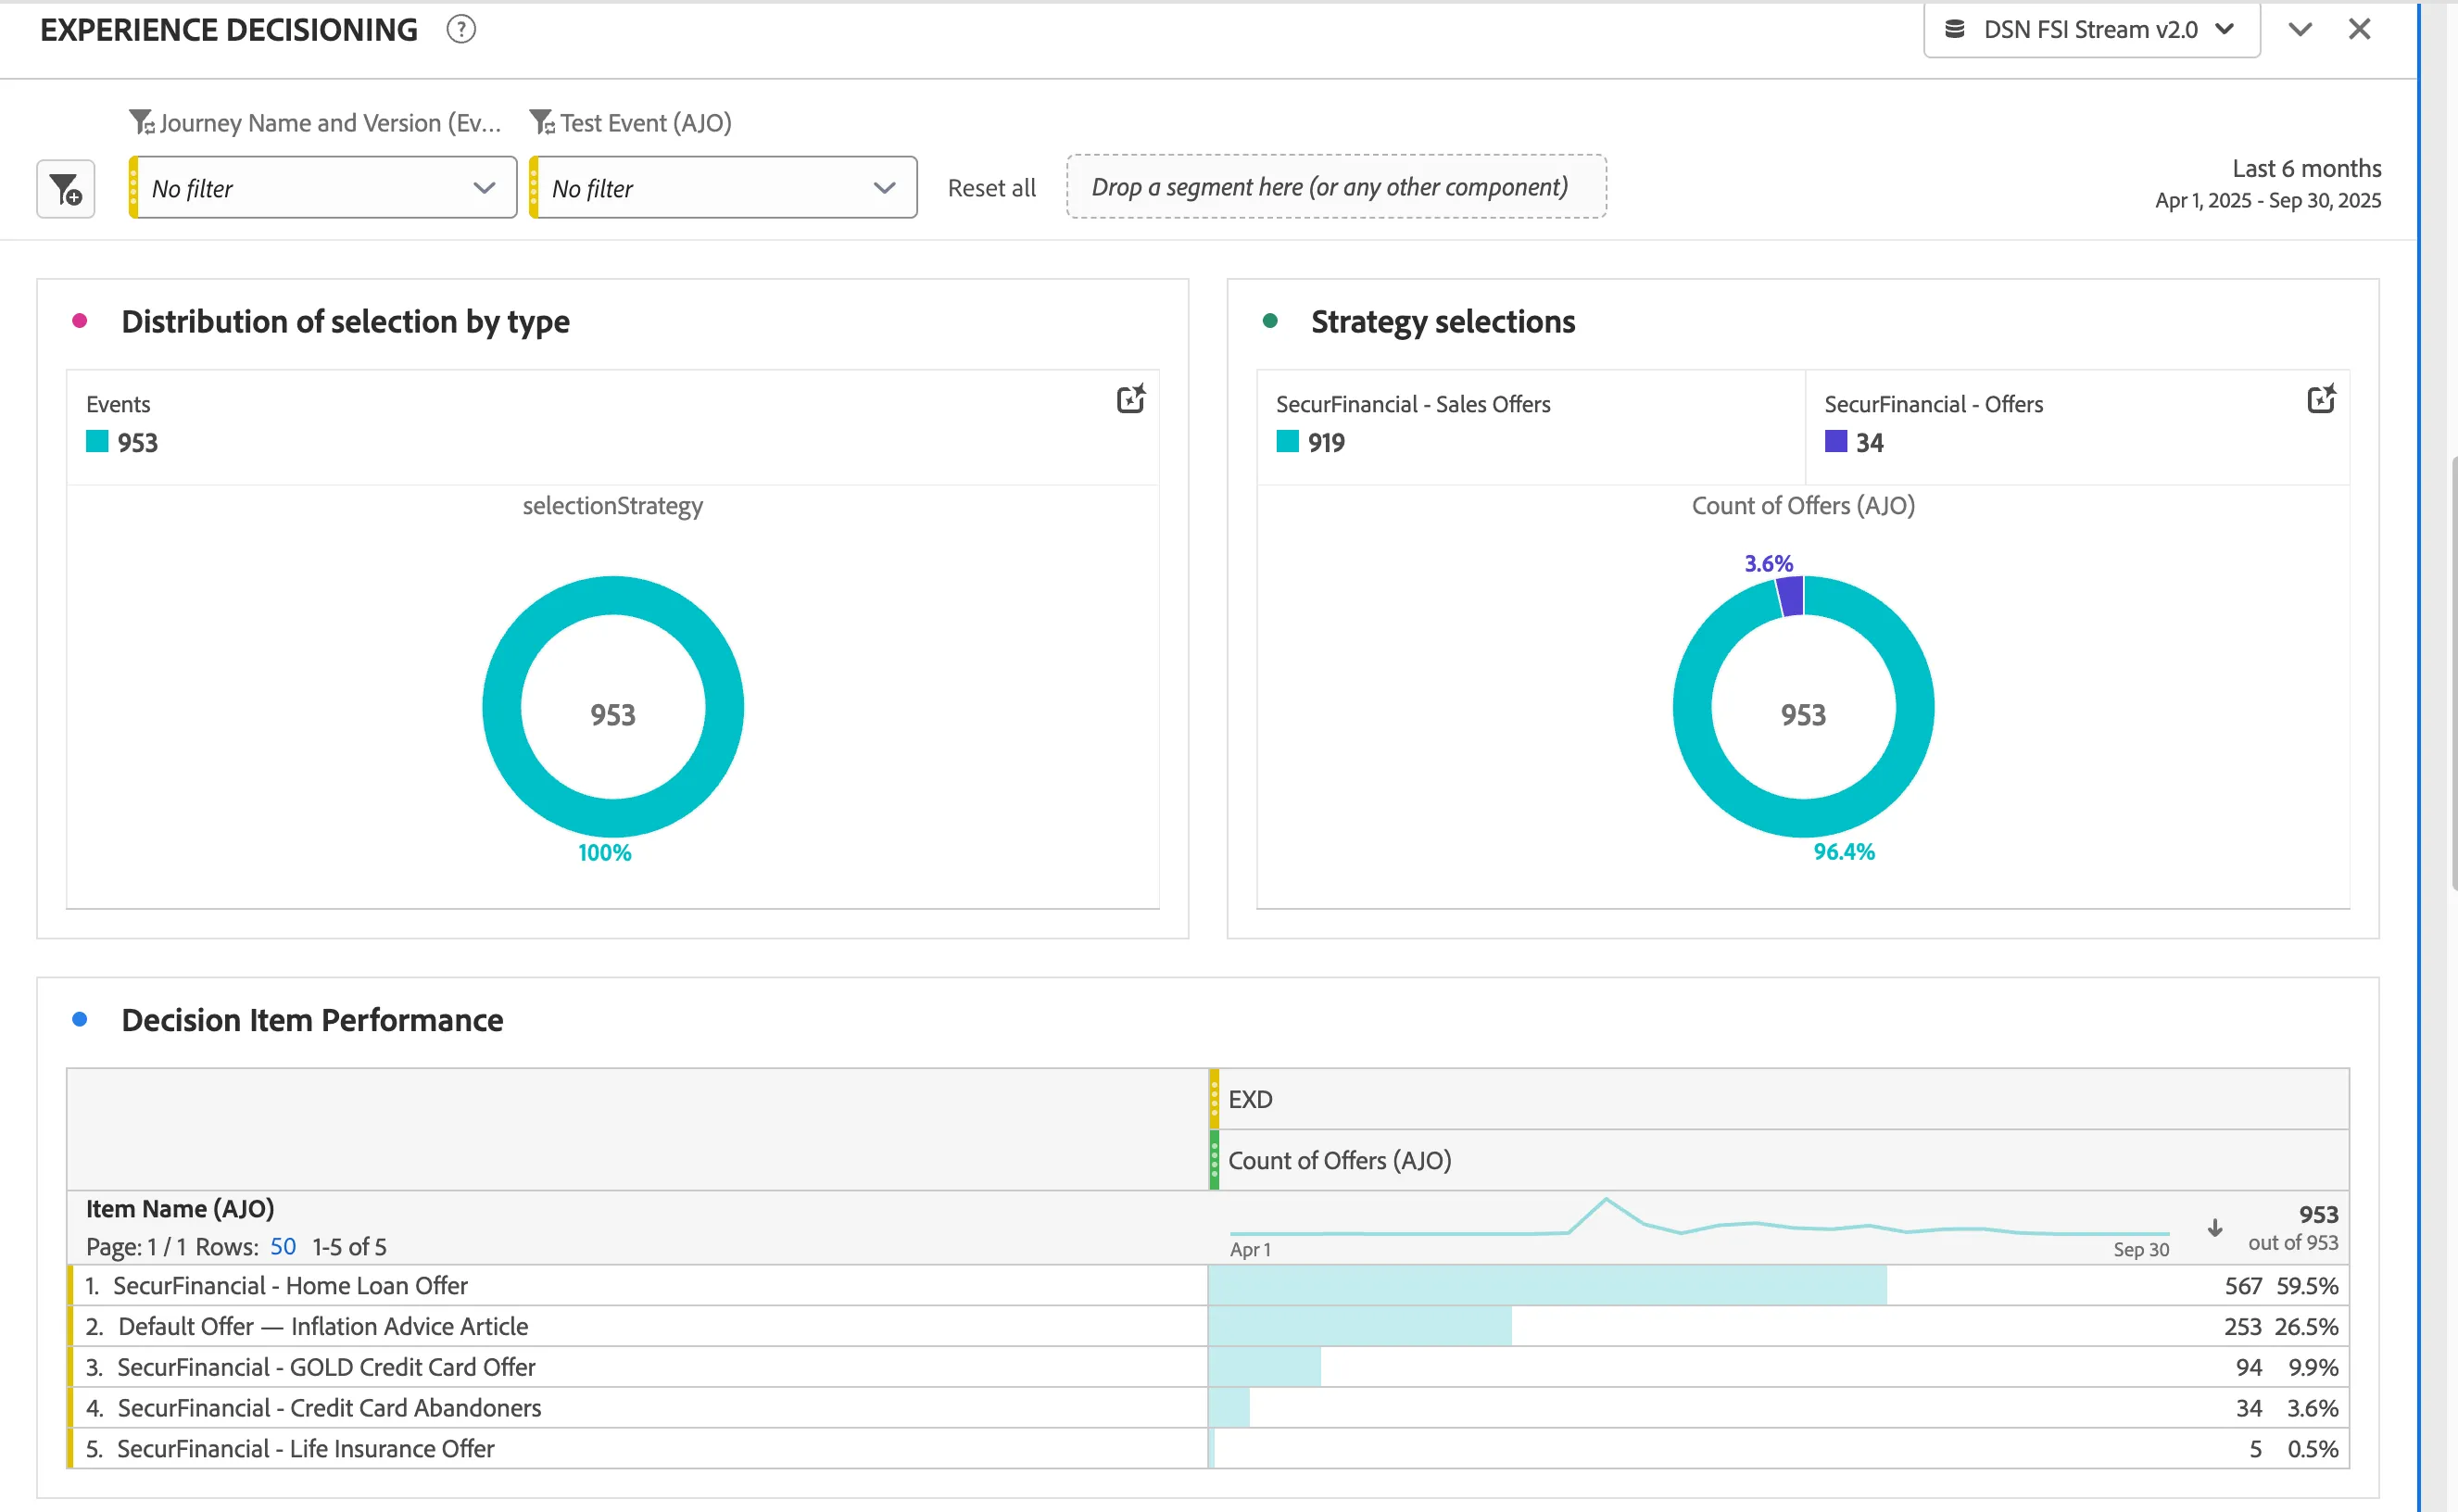
This panel offers a holistic view of the Experience Decisioning configured within the SecurFinancial Public Project Journeys. It consolidates and visualizes key metrics that reflect how decisioning is being applied and delivered across journeys.
The panel includes insights such as the total number of Decisions Sent, distribution across decision categories (e.g., Personalized vs. Fallback), as well as breakdowns like Experiences by Collection and Default Experience utilization. Together, these visualizations provide a comprehensive perspective on the effectiveness of decision strategies, enabling stakeholders to assess personalization performance, identify reliance on fallback scenarios, and evaluate how experience collections are contributing to customer engagement.
Unable to see the project in the list of reports?
Please contact us using the Slack discussion channel, #demo-system-next, and we will add you to the user group.